
Bluegraph: Unlocking NOAA Buoy Data in a 3D Wave Perspective
As developers, we often encounter scenarios where crucial environmental data is available, but accessing, interpreting, and visualizing it effectively presents a significant challenge. The National Oceanic and

As developers, we often encounter scenarios where crucial environmental data is available, but accessing, interpreting, and visualizing it effectively presents a significant challenge. The National Oceanic and Atmospheric Administration (NOAA) operates a vast network of buoys and stations, collecting invaluable oceanographic and meteorological data. However, harnessing this raw, often disparate information for real-world applications can be cumbersome.
The Challenge with Raw Environmental Data
NOAA's National Data Buoy Center (NDBC) and its partners maintain hundreds of stations globally, from the Bering Sea to Samoa, covering two oceans, the Caribbean, and the Great Lakes. These stations—including buoys, coastal stations, tide gauges, and estuary monitors—generate an immense volume of data. The sheer scale, evidenced by Bluegraph reporting over 113.7 million data points collected since April 2025, highlights the difficulty in sifting through and making sense of such a rich dataset.
Traditional interfaces for this data can be fragmented, requiring users to navigate multiple sources or parse raw data files. This complexity impedes developers looking to integrate this information into applications for maritime logistics, climate research, recreational planning, or educational tools. What's needed is a platform that centralizes, processes, and presents this data in an intuitive, actionable format.
Introducing Bluegraph: A 3D Lens on Ocean Data
Bluegraph addresses this challenge by providing a platform to explore NOAA buoy data, rebuilt and visualized. Its core differentiator lies in its ability to present complex ocean dynamics, moving beyond simple scalar readings to offer a richer understanding derived "in 3D from measured spectra." This suggests a sophisticated analytical engine that transforms raw spectral measurements—which contain information about all component waves present in the sea state—into a coherent, visually representable model.
The platform integrates observations from a comprehensive network, keeping track of hundreds of stations, with a snapshot showing 699 out of 715 stations reporting within a recent three-hour window. This demonstrates a robust system for continuous data ingestion and near real-time updates. By consolidating data from various station types, Bluegraph offers a unified view of the marine environment.
Technical Underpinnings: From Spectra to 3D Visualization
At the heart of Bluegraph's capability is the processing of measured spectra. Buoys don't just measure a single wave height; they record the energy distribution across various wave frequencies and directions. This raw spectral data is incredibly rich but complex. Bluegraph's system likely applies advanced signal processing techniques, such as Fourier analysis, to decompose these spectra into their constituent wave components. From this, key integrated parameters like significant wave height (Hs) and dominant wave period (Tp) are derived.
The platform explicitly states how these derived metrics are mapped to visual attributes: "Column height: significant wave height. Brightness: dominant period, 4 to 16 s." This indicates that Bluegraph processes the spectral data to generate visual representations where the magnitude of waves (significant wave height) dictates the vertical dimension, while the predominant rhythm or period of the waves is conveyed through an intensity attribute like brightness. This approach allows for a multi-dimensional understanding of the sea state, where users can perceive not just how big the waves are, but also how long they are and how quickly they are arriving, crucial for detailed wave analysis.
While the provided source is a textual snapshot of a homepage, this description strongly implies an interactive visualization layer, potentially utilizing modern web graphics APIs like WebGL or a similar rendering engine to present these reconstructed 3D wave fields. Such an implementation would require efficient data structures and rendering pipelines to handle dynamic updates across a vast geographical area.
Navigating and Utilizing Bluegraph's Data
Bluegraph's interface is designed for both quick insights and detailed exploration. The "Notable now" section acts as a real-time dashboard, highlighting critical conditions such as the biggest seas, longest-period swells, strongest winds, fastest-falling pressures, unusual tide levels, and temperature extremes. Each notable reading is linked directly to its respective station, enabling immediate deep-dives.
For broader regional analysis, the "Around the coasts" section organizes stations by geographic regions like the Eastern Seaboard, Great Lakes, Gulf of Mexico, and various Pacific regions. Each regional summary provides aggregated statistics, including the number of stations, live status, highest observed seas, median typical seas, and water temperature ranges. This bird's-eye view is invaluable for understanding regional patterns and trends.
Developers will appreciate the comprehensive data coverage and the ability to find specific stations by region or through an "All stations" list. The presence of "Query" and "Compare" sections in the navigation further hints at advanced data interaction capabilities, potentially including programmatic access or sophisticated filtering and comparison tools that could feed into custom applications. The inclusion of unit toggles (SI, Marine, US) also demonstrates a user-centric design that caters to diverse analytical needs, simplifying data conversion efforts for developers.
Practical Takeaways for Developers
Bluegraph offers several compelling advantages for developers working with oceanographic data:
- Centralized Access: It consolidates data from numerous NOAA sources, eliminating the need to interact with multiple, disparate APIs or data feeds.
- Enriched Data Context: By processing raw spectra into meaningful visual attributes like column height for significant wave height and brightness for dominant period, it provides a richer context than simple tabular data, making complex wave dynamics more accessible.
- Real-time Insights: The platform's commitment to near real-time updates for a vast network of stations supports applications requiring current environmental conditions.
- Scalability: Managing over 100 million data points and hundreds of stations implies a robust and scalable backend architecture, which can serve as an inspiration for similar large-scale data projects.
- Foundation for Integration: While not explicitly an API, the "Query" and "Compare" features, combined with station-specific links, suggest a well-structured data foundation that could be integrated into other systems, perhaps via screen scraping or a future API offering.
It's crucial to note Bluegraph's disclaimer that "Realtime observations are provisional and have not been quality-controlled." Developers building applications that rely on the highest data integrity must factor this into their design, perhaps by integrating quality checks or using historical, quality-controlled datasets for critical analyses.
In essence, Bluegraph demonstrates a powerful approach to transforming raw, complex scientific data into an intuitive, visually rich, and highly informative resource, unlocking new possibilities for developers in maritime, environmental, and data visualization domains.
FAQ
Q: What is the primary source of the data displayed on Bluegraph?
A: Bluegraph sources its data from NOAA's National Data Buoy Center and its associated partners, covering a wide array of buoys, coastal stations, tide gauges, and estuary stations.
Q: How does Bluegraph use "measured spectra" to create a 3D view of the ocean?
A: Bluegraph processes the raw spectral data from buoys to derive key parameters like significant wave height and dominant wave period. It then maps these metrics to visual attributes, for example, using column height to represent significant wave height and brightness to indicate the dominant period (between 4 and 16 seconds), effectively rebuilding the sea state in a multi-dimensional visualization.
Q: Are the real-time data observations on Bluegraph considered fully accurate and quality-controlled?
A: No, Bluegraph explicitly states that real-time observations are provisional and have not undergone full quality control. Developers should be aware of this and account for potential inaccuracies in applications built upon this live data.
Related articles

The Hunt for Mewtwo: Snagging Pokémon's 30th Anniversary Promo Card
Get ready for Pokémon TCG's 30th anniversary with an exclusive Mewtwo promo card illustrated by Nagisimo, available starting October 2, 2026. This special card is obtained by spending $15 at select U.S. retailers, coinciding with the second wave of anniversary products. Plan early, as these limited-time drops are expected to go fast!
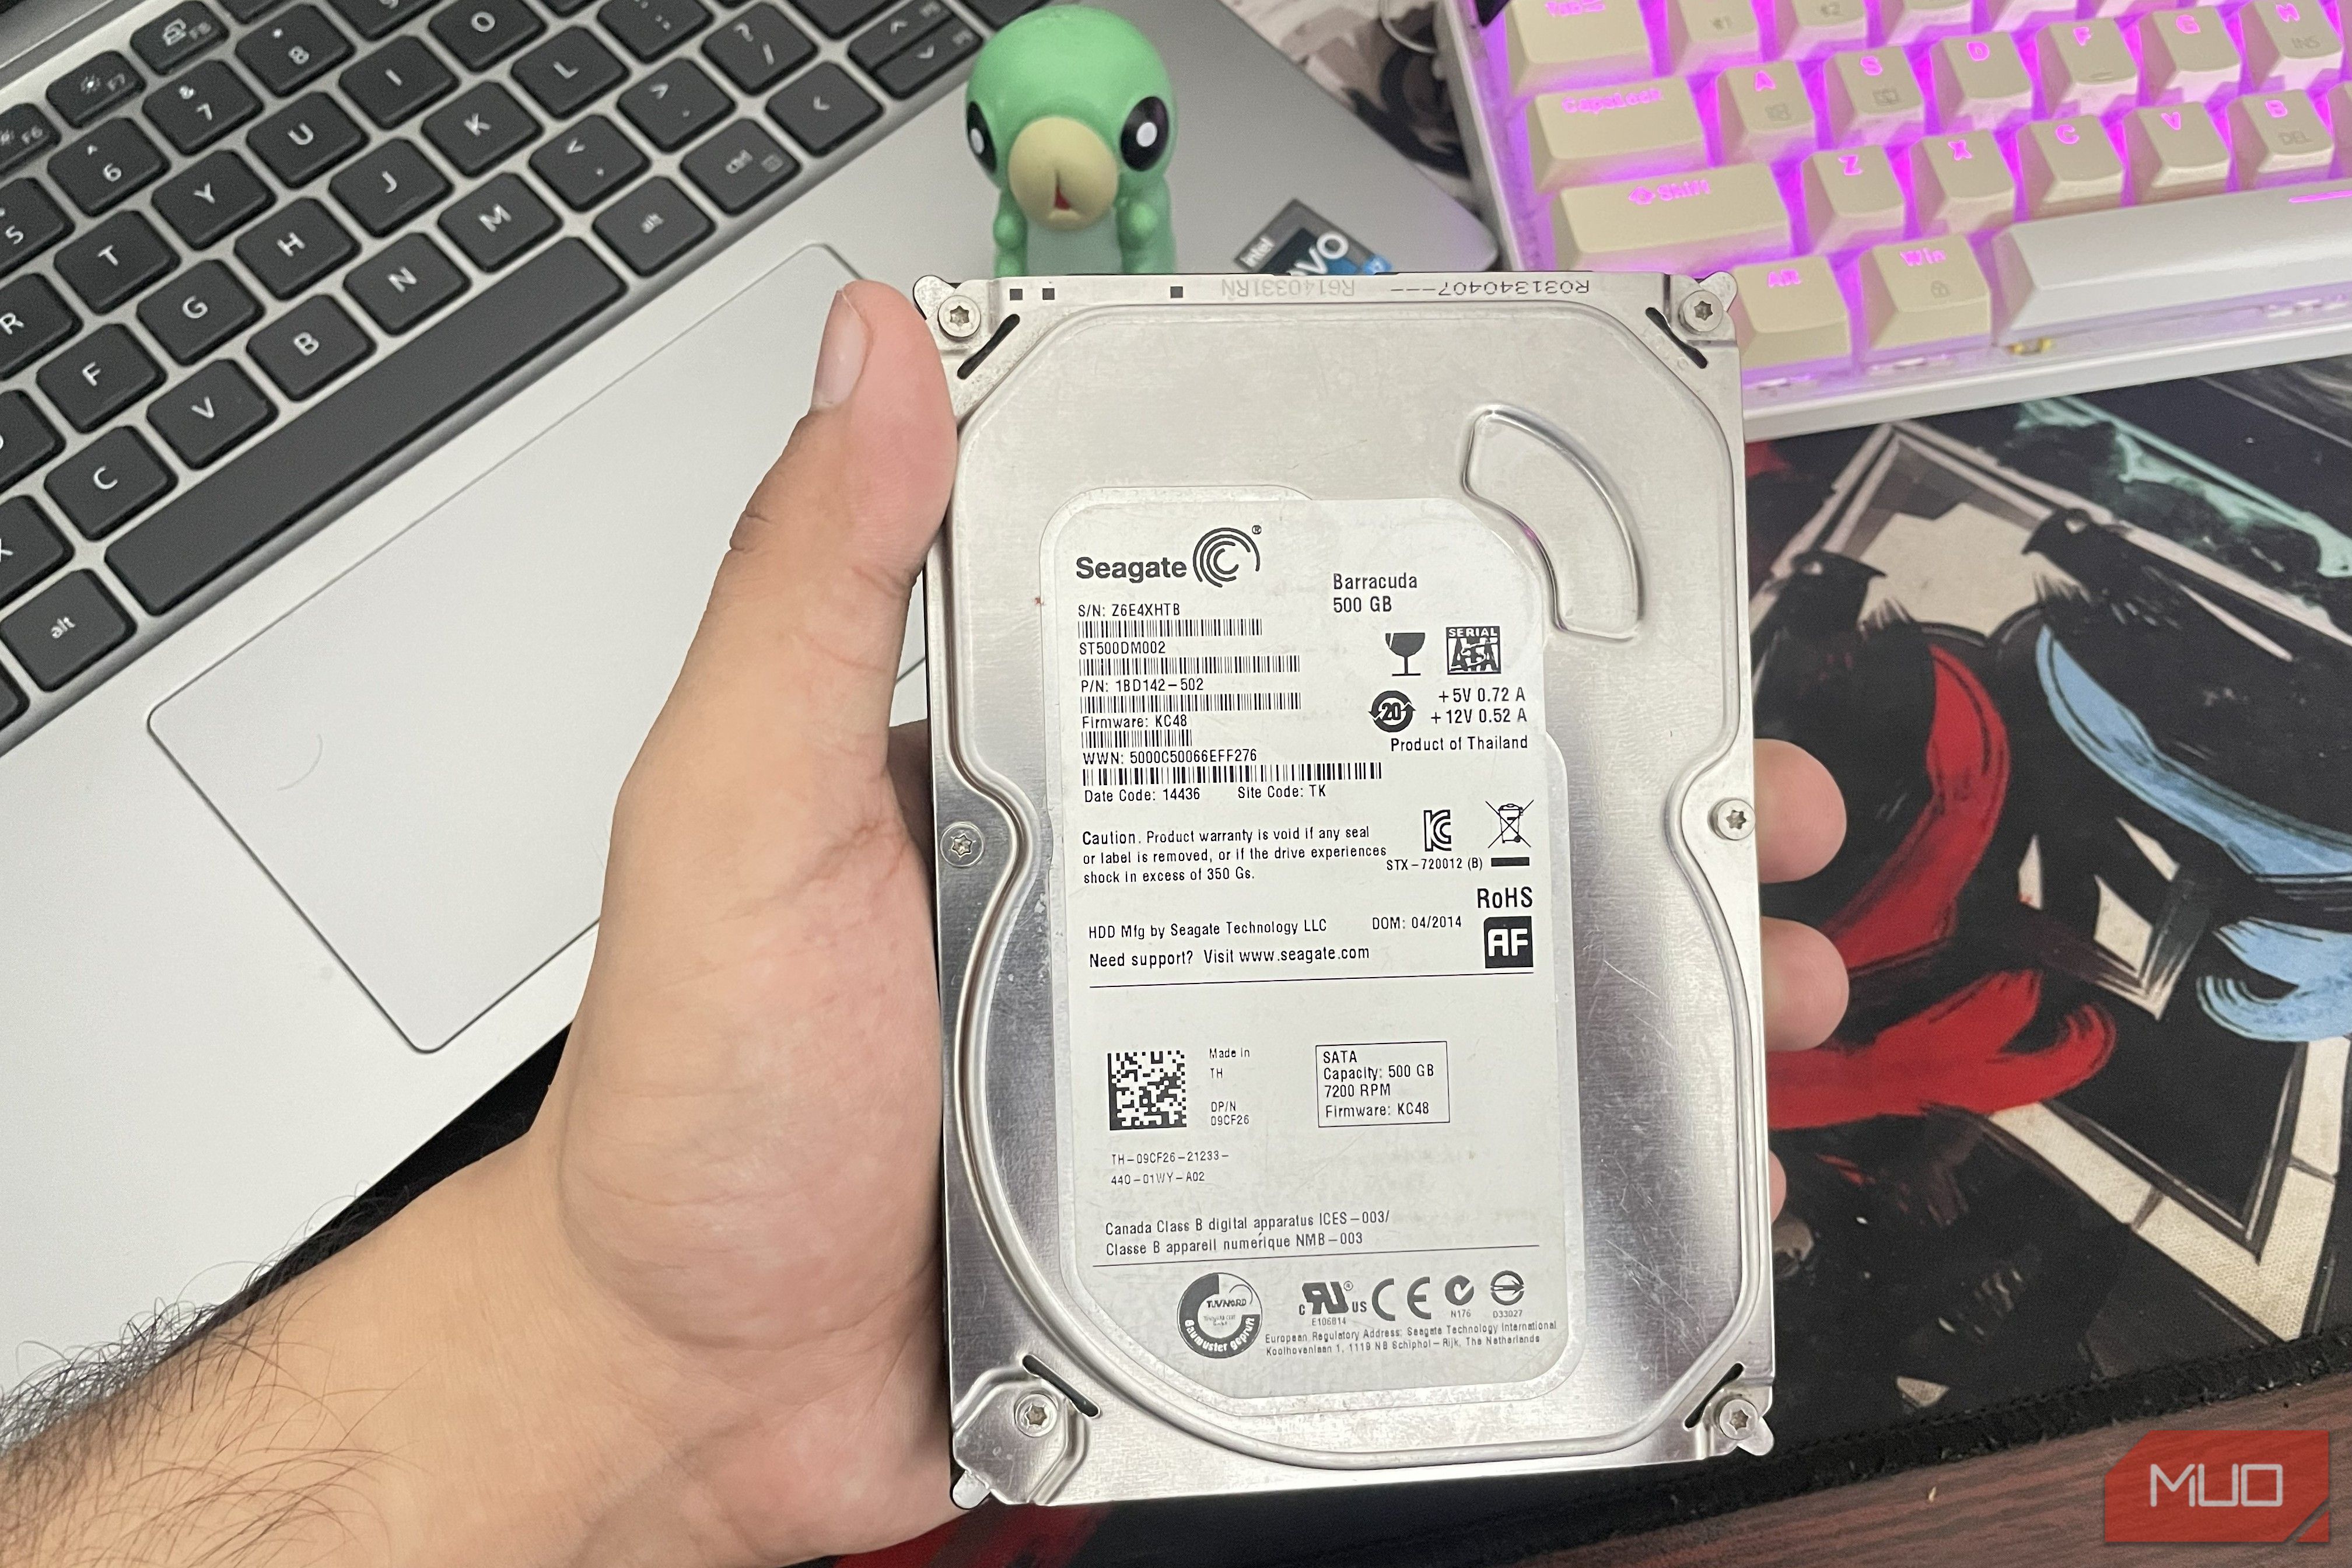
Boost Your Old HDD's Life: What 400k Drives Reveal About Reliability
Discover how HDD reliability varies by brand, backed by a study of over 400,000 drives. Learn which manufacturers offer the most robust drives, understand age-related failure patterns, and get actionable tips to optimize drive temperature and safeguard your data for maximum longevity.

Amazon Ends Data Center NDAs Amid Mounting Public, Political Pressure
Amazon has announced it will no longer use nondisclosure agreements (NDAs) with county officials for its data center projects. This policy reversal, revealed by CEO Matt Garman, addresses widespread community backlash and a surge in legislative efforts targeting the secrecy of data center developments. The company also pledged a $1 billion investment in data center communities over five years, focusing on education, workforce training, and energy efficiency.

Developer Survey Retrospective: AI, Work, and Learning (2024-2025)
This retrospective analyzes 2024-2025 Stack Overflow Developer Survey data, highlighting surging AI tool adoption alongside tempered developer enthusiasm. It examines evolving work models, key job satisfaction drivers like autonomy, and the complex relationship between AI and deep learning. These insights set the stage for the 2026 survey.
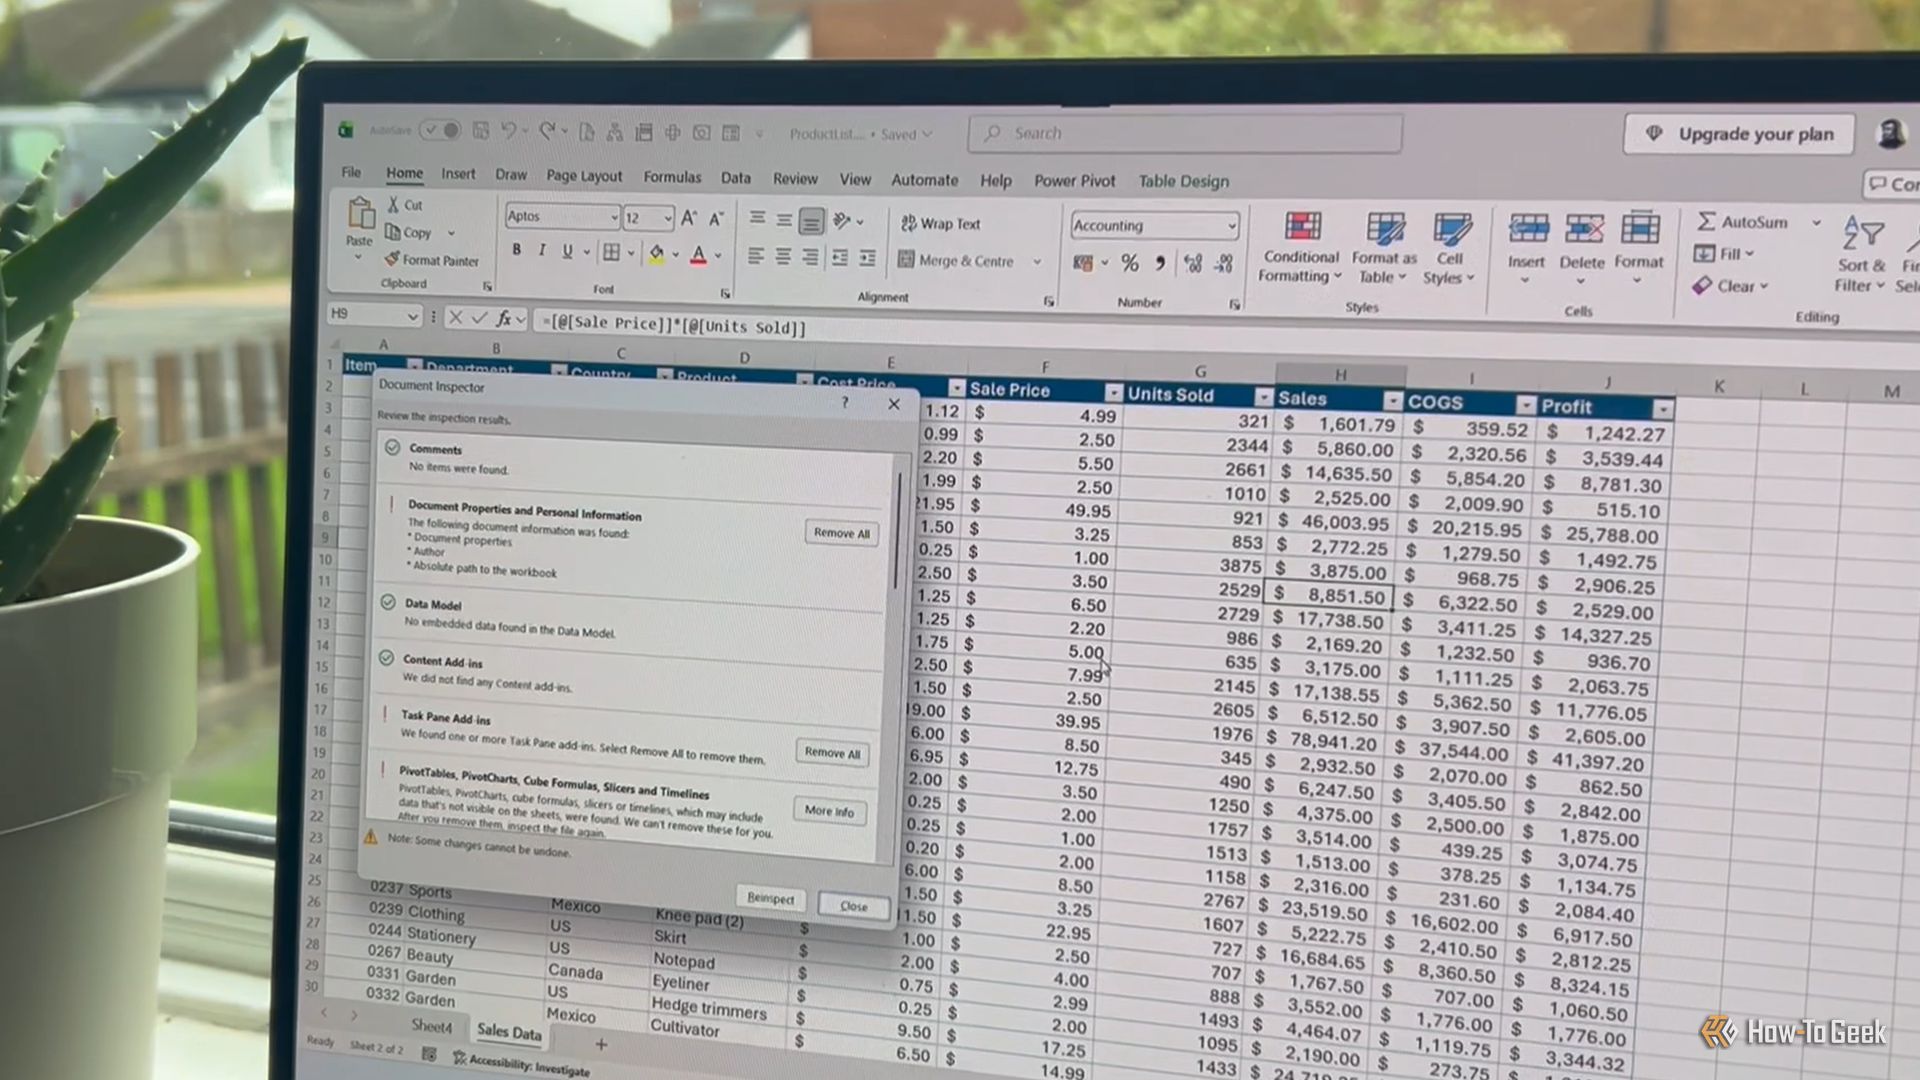
Prevent Hidden Data Leaks: Inspect Your Excel Files Before Sharing
Sharing an Excel file might seem straightforward, but your workbook could be holding onto more information than you realize. Beyond the visible cells, Excel files often contain hidden worksheets, personal metadata,

GLM-5.3: A New Frontier in Accessible Cyber Exploitation
Zhipu AI's GLM-5.3 model offers advanced, end-to-end cyber exploitation capabilities, comparable to highly controlled frontier models like Claude Mythos Preview. However, its open-weight nature and easily bypassed safeguards (via abliteration, deceptive prompts, or prefilled thinking tokens) make these potent tools widely accessible to malicious actors. This development significantly alters the cyber threat landscape, demanding that defenders leverage equally advanced AI tools and prioritize proactive security measures.